
STC vs the Real World and the Rated Power Output Myth
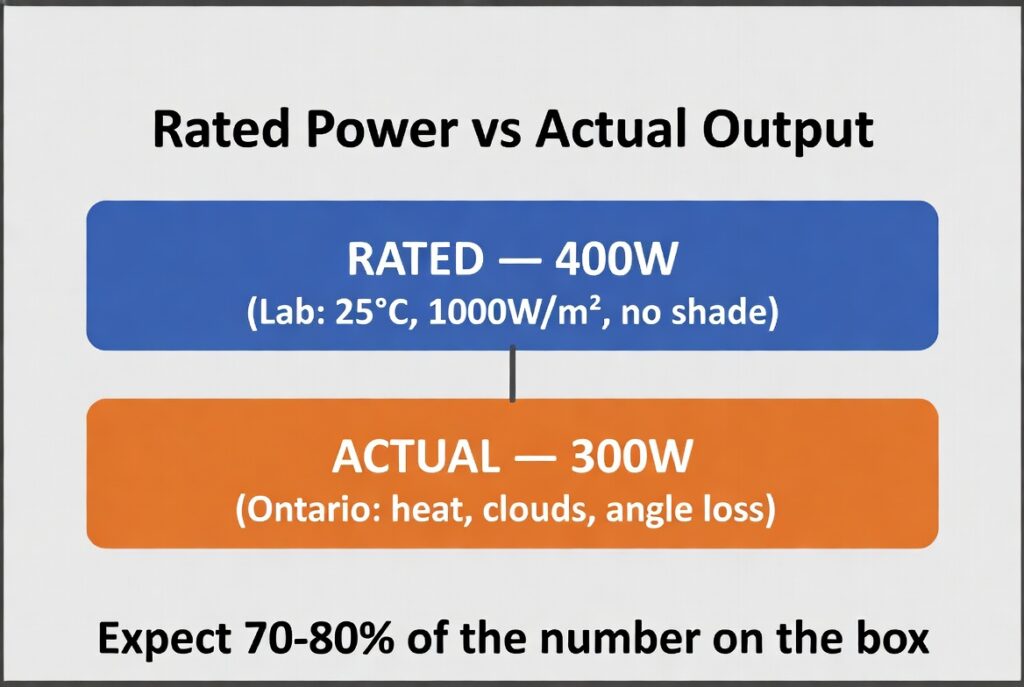
The rated power output on your solar panel box is measured in a laboratory at 25 degrees C with perfect light, and your Ontario rooftop will never replicate those conditions because real-world output is 70 to 80 percent of rated. Standard Test Conditions (STC) are set at 25 degrees C cell temperature, 1000W/m2 irradiance, and AM 1.5 air mass. These lab-perfect conditions exist nowhere in Ontario. The gap between STC and reality is 20 to 30 percent.
An Ontario rooftop in July reaches 55 to 65 degrees C cell temperature with average irradiance between 600 and 900W/m2. Clouds and atmospheric haze add variable air mass that further reduces output. A 400W panel on your shed roof will peak at 280W to 320W on the best summer afternoon. That is not a defect. That is physics. For the complete panel selection guide, see our solar panel guide.
The Rockwood 75 Percent Sizer
A homeowner in Rockwood planned a 4,000W array for his off-grid system. Instead of assuming 4,000W of actual production, he applied the 75 percent reality rule and sized his Victron MultiPlus-II and battery bank to handle a real-world peak of 3,000W. He installed ten 400W panels on a south-facing roof at 35 degrees tilt. His Victron MPPT 100/50 displayed real-time harvest data through the VictronConnect app.
When July arrived with 35 degrees C ambient temperatures, his panels peaked at 3,100W instead of 4,000W. His system performed exactly as predicted because he sized for 75 percent, not 100 percent. His batteries reached full charge by 2:00 PM every clear day with headroom to spare. Because he did not redline his system expectations, his charge controller ran cooler and his MPPT efficiency stayed above 98 percent instead of dropping to 95 percent under thermal stress.
The rated power output on a solar panel is exactly like a car’s EPA fuel economy sticker. The sticker says 40 mpg because they tested it on a flat treadmill with no wind. In Ontario, uphill, into a headwind, with the AC running, you get 28 mpg. If you plan your cross-country trip based on the lab number, you run out of gas. Size your solar system for the road, not the dyno.
The Heat Tax and Why Hot Roofs Kill Panel Efficiency
The temperature coefficient for most monocrystalline panels is -0.35 percent per degree C above 25 degrees C. A black shingle roof in July raises panel cell temperature to 55 to 65 degrees C. That is a 30 to 40 degree C delta above STC. At -0.35 percent per degree C, a 40 degree C delta produces a 14 percent power loss from heat alone.
Mounting panels with an air gap underneath reduces cell temperature by 10 to 15 degrees C. Ground-mounted arrays run cooler than roof-mounted because air circulates on all sides. Tilted rack mounts on a flat roof provide better airflow than flush mounts on a pitched roof. The rated power output gap shrinks from 25 percent to 15 percent with proper mounting and ventilation. For the complete temperature analysis, see our battery temperature guide.
The Real-World Comparison Table and the Rated Power Output Gap in Ontario
| Condition | Standard Test (STC) | Ontario Reality (Summer) | Output Impact |
|---|---|---|---|
| Cell Temperature | 25 degrees C | 55 to 65 degrees C | -12% to -15% |
| Light Level | 1000W/m2 | 600 to 900W/m2 | -10% to -20% |
| Air Mass | 1.5 (Optimal) | Variable (Clouds/Haze) | -5% to -10% |
| Total Factor | 100% Rated | 70% to 80% Actual | The Gap |
The table shows why a 400W panel produces 280W to 320W on an Ontario rooftop. NOCT (Nominal Operating Cell Temperature) is a slightly more realistic rating at 45 degrees C and 800W/m2, but still optimistic for Ontario summer conditions. The 75 percent reality rule is the most accurate sizing tool for this climate. Multiply your total rated watts by 0.75 to get the realistic Ontario summer peak. For the complete payback formula, see our solar payback guide.
The Milton STC Disappointment and the 75 Percent Reality Rule
A DIYer in Milton bought ten 400W panels expecting 4,000W of actual output to charge his LFP bank. He sized his battery bank for 4,000W of daily input. He mounted the panels on a black asphalt shingle roof with no air gap underneath. He did not account for the temperature coefficient listed on the panel datasheet.
On a hot July afternoon, his panel cell temperatures reached 65 degrees C. The temperature coefficient of -0.35 percent per degree C above 25 degrees C meant a 40 degree C delta, producing a 14 percent power loss from heat alone. His panels peaked at 3,100W instead of 4,000W. He fell 25 percent short of his daily energy goal, leaving his batteries at 70 percent SoC by sunset and forcing him to run a generator by midnight.
He initially blamed “defective panels” and spent 20 hours on hold with the manufacturer’s tech support. The panels were performing exactly within their rated specifications. The datasheet clearly stated the temperature coefficient and the NOCT rating. The problem was not the panels. The problem was sizing a system for 100 percent of the rated power output instead of 75 percent of it. A Victron SmartShunt would have shown the actual daily harvest in real time and confirmed the system was performing within specifications. For the complete load calculation method, see our solar sizing guide. For the wiring configuration that maximizes harvest, see our series vs parallel wiring guide.
Frequently Asked Questions
Q: Why does my 400W solar panel only produce 300W?
A: The 400W rating is measured under Standard Test Conditions at 25 degrees C cell temperature and 1000W/m2 irradiance, which never exist on an Ontario rooftop. Your panel loses 10 to 15 percent from heat alone when cell temperature reaches 55 to 65 degrees C on a summer afternoon. Add another 10 to 20 percent loss from lower irradiance and atmospheric conditions, and your actual output is 70 to 80 percent of rated, which is 280W to 320W for a 400W panel.
Q: What is the 75 percent reality rule?
A: Multiply your total rated panel wattage by 0.75 to get the realistic peak output for Ontario summer conditions. Size your battery bank and inverter for this number, not the STC rating on the box. A 4,000W rated array should be paired with a battery bank and charge controller sized for 3,000W of actual peak input.
Q: Does temperature affect solar panels in winter too?
A: Cold temperatures actually increase panel voltage and output because the temperature coefficient works in reverse below 25 degrees C. A panel at minus 10 degrees C in January produces 12 percent more voltage than its STC rating. However, Ontario winter irradiance at 1.5 PSH is so low that the voltage increase does not compensate for the reduced sunlight hours.
NEC Article 690 covers PV system installation requirements including panel sizing, inverter matching, and overcurrent protection standards that account for real-world output conditions. All systems must be sized for actual expected output, not rated power output alone. Current standards are published at nfpa.org.
CEC Section 64 governs solar panel installation requirements in Ontario including mounting, wiring, and system sizing standards. All permanent installations require ESA-compliant design that accounts for Ontario climate conditions. The Electrical Safety Authority (ESA) provides current compliance guidelines at esasafe.com.
This build is engineered within the 48V DC Safety Ceiling. Diagnostic logic is based on 20+ years of technical service experience. All structural and electrical installations must be verified by a Licensed Professional and comply with your Local AHJ. See our legal and safety disclosure for full scope.
About the Author
Robert Bertrand spent 20 years as a service advisor in the automotive industry (Lexus and Nissan), where precision diagnostics, wiring integrity, and documentation standards were non-negotiable. He brings that same technical discipline to GridFree Guide, where he researches, tests, and documents off-grid solar systems for Ontario conditions. Based in Rockwood, Ontario, every article is built on verified specifications, manufacturer data, and the real-world climate constraints of Canadian off-grid living.
As an Amazon Associate I earn from qualifying purchases. This site also contains affiliate links to other products and services. GridFree Guide earns a small commission at no extra cost to you.